Key Takeaways: The shoeshine boy indicator resurfaces as the S&P 500 breaks its nine-week winning streak, though Goldman Sachs data show exuberance below bubble levels.
Back
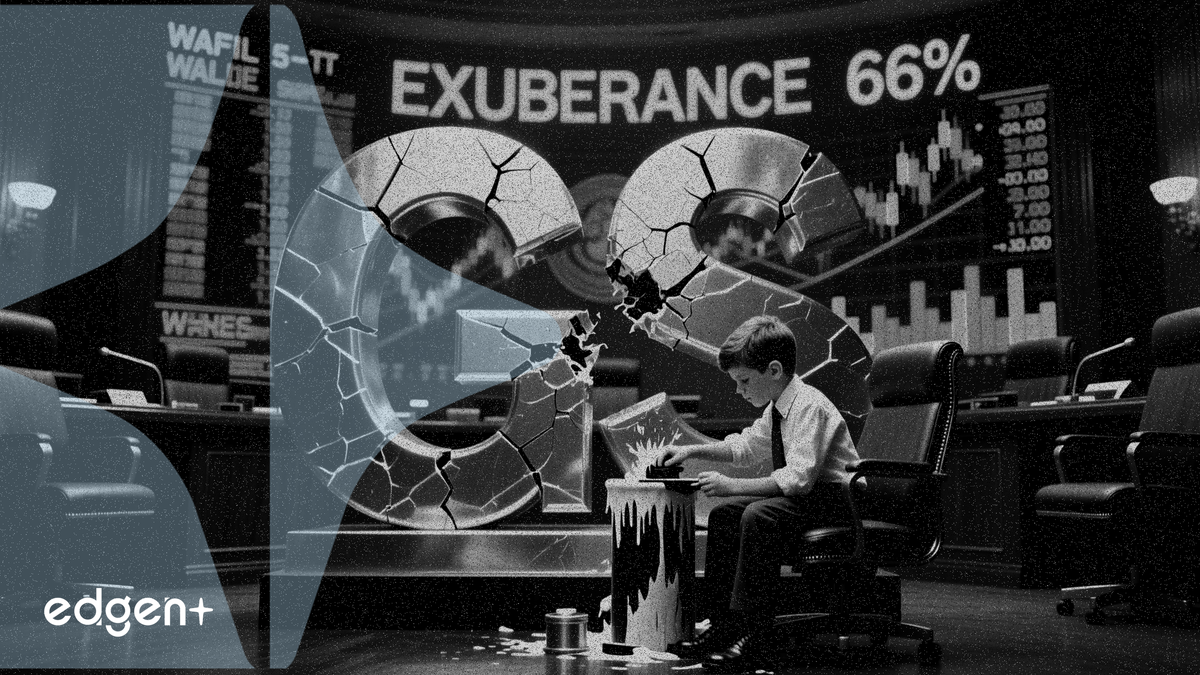
Shoeshine boy indicator returns as Goldman Sachs flags 66% exuberance reading
The S&P 500 slumped 2.6% on Friday, its worst session since October, snapping a nine-week winning streak that had pushed the benchmark index to within 4% of its all-time high set in late 2021.
"The data show elevated readings but nothing approaching the speculative mania of 2000 or 2021," said Ben Snider, U.S. equity strategist at Goldman Sachs.
Goldman's analysis of nine indicators across four categories — share prices, trading activity, investor sentiment and corporate sentiment — placed the average percentile at 66%. That compares with the 99% peak during the dot-com bubble in 2000 and the 92% reading during the meme-stock frenzy of 2021. Research momentum scored in the 98th percentile while market breadth hit the 94th, though Snider noted that a 16% surge in earnings-per-share growth estimates had outpaced the index's 8% gain over the same period.
The debate over whether the rally has run too far comes as the Federal Reserve's June meeting on June 17-18 approaches, with markets pricing a 78% probability of rates remaining unchanged, according to CME FedWatch data. A hotter-than-expected inflation print or hawkish Fed commentary could accelerate the pullback.
Nine Indicators, One Reading
The Goldman Sachs framework evaluated a range of metrics to gauge whether investor euphoria had reached unsustainable levels. The put-call ratio, a widely followed measure of bearish versus bullish options bets, registered in the 88th percentile. Short interest stood at 3.2% of S&P 500 index capitalization — the highest level since the global financial crisis of 2008, suggesting a significant pool of bearish bets that could fuel a short squeeze if the market reverses higher.
The firm's proprietary speculative trading indicator has risen in recent months but remains well below prior peaks seen in 2000 and 2021, Snider and his team wrote in a note to clients on Friday.
Survey-based measures of investor sentiment painted a more nuanced picture. The Yale U.S. stock market confidence indices showed extreme bullishness in the 97th percentile, reflecting institutional optimism. By contrast, the American Association of Individual Investors weekly poll found more respondents bearish at 37% than bullish at 36%, with the remainder neutral — a divergence that suggests retail investors remain cautious even as professional money managers turn more aggressive.
Corporate Activity Offers Reassurance
Corporate sentiment readings provided the most comforting data for investors concerned about frothy markets. The number of initial public offerings in 2026 is on track to match long-term averages, a far cry from the IPO frenzy of 2021 when companies rushed to list at elevated valuations. Net equity issuance — the difference between corporate buybacks and share sales — is expected to match the average volume from 2015 to 2019, Goldman said, indicating that companies are not aggressively selling shares into strength.
The shoeshine boy indicator, an anecdotal market signal popularized by Joseph Kennedy's purported stock sale after receiving unsolicited tips from a shoeshine boy before the 1929 crash, has been circulating in financial media as a warning sign. The Wall Street Journal solicited reader stories on the phenomenon, reflecting the narrative's growing traction among market participants who view it as a contrarian sell signal.
Goldman's analysis suggests that while pockets of exuberance exist — particularly in momentum-driven strategies and market breadth — the broader market has not reached the extreme valuations or speculative behavior that historically precede major downturns. The firm identified disappointing economic growth, elevated equity issuance and tightening Fed policy as the conditions that typically end bull markets, noting that none of these factors are present today but each appears closer than it did a few months ago.
This article is for informational purposes only and does not constitute investment advice.
[1] A Sign of the Market Top? Tell Us Your ‘Shoeshine Boy' Story[2] A sign of the market top? Tell us your ‘shoeshine boy’ story[3] Goldman Sachs: Signs of market exuberance are rising, but fall short of prior bubbles[4] What nine different indicators say about market exuberance, according to Goldman Sachs[5] Bull Market Guide: The Different Phases And How To Invest During One
© 2026 Edgen Powered by